Convex hull is one of the most widely used techniques for finding the minimum enclosing shape around a set of points in a plane, but for certain tasks it is necessery to find such shape which encloses concave parts of the outline as well. Convex hulls are also sensitive to localized point groups, far apart from the majority of other points. In these cases, hulls enclose a lot of empty space so that the possible underlining shape is obscured. In geometric morphometrics, outlines around the set of landmarks in the plane can provide the idea of shape, useful for visualization of the underlining shape (i.e. the shape described by these points). Possibly, such outlines may be analysed further, with the usual GM analytic procedures. Alpha shape1 is the generalization of the convex hull for a set of points in the plane which can be used for shape reconstruction, since the frontier of an alpha shape is a linear approximation of the original shape. In R, this technique is implemented in the alphahull library. For this post, randomly generated points-in-the-plane data will be used.
1 2 | |
For a set of points, alpha shape is based on the Delaunay triangulation and its corresponding Voronoi diagram, so they are found first, followed by alpha shape and alpha hull.
1 2 | |
The value of the parameter alpha is determined with respect to the dimensionality of data points, since it represents the minimal distance for icnlusion or exclusion of the neighbouring points within the alpha shape procedure.
1 2 3 4 | |
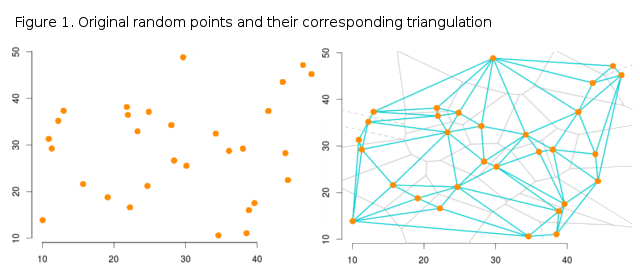
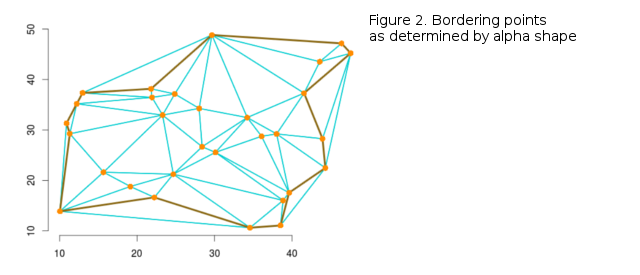
When the value of alpha is selected taking into account the spacing between the points, the enclosing outline can be obtained so that it approximates the most probable shape of the points in the plane (Figure 1, Figure 2).


-
Edelsbrunner, H., Kirkpatrick, D.G. and R. Seidel. 1983. On the shape of a set of points in the plane. IEEE Transactions on information theory, 29: 551-559.↩