Creative morphometrics

Using R and python for colorful research of biological shape

Complete Procrustes in Python

Procrustes superimposition is the first analytic step in geometric morphometrics and this post shows one possible solution to performing it in Python1, using several functions defined in previous posts. First steps include data generation and definition of functions important for extracting shape variables from randomly generated landmark data. These functions are centsize which calculates centroid size from a numpy array (xy data) and transScale which translates landmark coordinates to the origin of the coordinate system and scales them to unit centroid size. The mshapr function is needed in the main superimposition function since it calculates succesive mean shapes (all configurations), excluding the configuration that is currently being rotated.

Import libraries, function definition and data generation
1
2
3
4
5
6
7
8
9
10
11
12
13
14
15
16
17
18
19
20
21
22
23
24
25
26
27
28
29
30
31
32
33
34
import numpy as np
import pandas as pd
import matplotlib.pyplot as plt
import scipy.spatial.distance as sd

def centsize(M): #centroid size
  p = M.shape[0]
  csize = np.sqrt(np.sum(M.var(0))*(p-1))
  return csize

def transScale(M):  #translation and scale
  tM = M - M.mean()
  centSize = centsize(M)
  tM = tM / centSize
  return tM

def mshapr (pdf):  #which is a pandas DataFrame, coordinates and individuals columns
  meanShapes = pd.DataFrame()
  dimen = len(allCoords.individuals.unique())
  for ind in range(0, dimen):
    temp = pdf[pdf.individuals != ind]
    meanShape = temp.iloc[:,0:2].groupby(temp.iloc[:,2]).mean()
    meanShapes = meanShapes.append(meanShape)
  return meanShapes

coordstest = np.vstack([np.random.uniform(175, 220, 10),   #usual data generation
                        np.random.uniform(175, 220, 10)]).T
coords = np.vstack([np.random.multivariate_normal(coordstest[i,:], [[3,0],[0,3]], 200) for i in range(10)])
coordinates = pd.Series((np.arange(0,10).reshape(-1,1)*np.ones(200).reshape(1,-1)).flatten()) #coordinates column
individuals = np.tile(np.arange(0,200),10) #individuals column
allCoords = pd.DataFrame(coords, columns = ['x','y'])
allCoords['coordinates'] = coordinates
allCoords['individuals'] = individuals
allCoords = allCoords.sort_index(by = ['individuals','coordinates'])

Definition of the pProc function follows the same rules as in the previous post, with the robust (and ugly for now) if clause that is only included to allow either pandas DataFrame or a numpy array as the input data (both for configurations and mean shape objects). It also returns only the rotated matrix, landmark configuration (pmat1) and not the mean shape.

pProc function for two configuration matrices
1
2
3
4
5
6
7
8
9
10
11
12
13
14
15
16
17
18
19
20
21
22
23
24
25
26
27
28
29
30
31
32
33
34
35
36
37
38
39
40
41
42
43
44
45
46
47
48
49
def pProc(mat1, mat2): #returning only centred preshape of mat1 on mat2
  if type(mat1) is np.ndarray and type(mat2) is np.ndarray:
    k = mat1.shape[1]-1
    m = mat1.shape[0]
    sscaledMat1 = mat1 / centsize(mat1)
    sscaledMat2 = mat2 / centsize(mat2)
    z1 = sscaledMat1 - [sscaledMat1[:,0].mean(), sscaledMat1[:,1].mean()]
    z2 = sscaledMat2 - [sscaledMat2[:,0].mean(), sscaledMat2[:,1].mean()]
    tempSv = np.dot(np.transpose(z2), z1)
    svdMat = np.linalg.svd(tempSv)
    U = svdMat[0]
    V = svdMat[2]
    Ds = svdMat[1]
    tempSig = np.linalg.det(np.dot(np.transpose(z1), z2))
    sig = np.sign(tempSig)
    Ds[k] = sig * np.absolute(Ds[k])
    U[:,k] = sig * U[:,k]
    Gam = np.dot(V, np.transpose(U))
    beta = np.sum(Ds)
    pmat1 = np.dot(z1, Gam)
    pmat1 = pd.DataFrame(pmat1, columns = ['x','y'])
    return pmat1
  else:
    mat1x = mat1.iloc[:,0]
    mat1y = mat1.iloc[:,1]
    mat1 = np.concatenate([mat1x, mat1y], axis = 1).reshape(mat1.shape[1],mat1.shape[0]).T
    mat2x = mat2.iloc[:,0]
    mat2y = mat2.iloc[:,1]
    mat2 = np.concatenate([mat2x, mat2y], axis = 1).reshape(mat2.shape[1],mat2.shape[0]).T
    k = mat1.shape[1]-1
    m = mat1.shape[0]
    sscaledMat1 = mat1 / centsize(mat1)
    sscaledMat2 = mat2 / centsize(mat2)
    z1 = sscaledMat1 - [sscaledMat1[:,0].mean(), sscaledMat1[:,1].mean()]
    z2 = sscaledMat2 - [sscaledMat2[:,0].mean(), sscaledMat2[:,1].mean()]
    tempSv = np.dot(np.transpose(z2), z1)
    svdMat = np.linalg.svd(tempSv)
    U = svdMat[0]
    V = svdMat[2]
    Ds = svdMat[1]
    tempSig = np.linalg.det(np.dot(np.transpose(z1), z2))
    sig = np.sign(tempSig)
    Ds[k] = sig * np.absolute(Ds[k])
    U[:,k] = sig * U[:,k]
    Gam = np.dot(V, np.transpose(U))
    beta = np.sum(Ds)
    pmat1 = np.dot(z1, Gam)
    pmat1 = pd.DataFrame(pmat1, columns = ['x','y'])
    return pmat1

Finally, the pGP function, that can perform partial Procrustes superimposition for any number of individuals (landmark configurations) and landmarks. Generated data has 200 individuals and 10 2D landmarks. For now this function will ask such information in the function call, so that mmat1 is pandas DataFrame with x, y, coordinates and individuals columns (generated above), numind is the number of individuals, dim is 2D (3D not yet supported), and numland is the number of landmarks. For clearer understanding of the following code, comments are included where appropriate.

Partial Procrustes Superimposition
1
2
3
4
5
6
7
8
9
10
11
12
13
14
15
16
17
18
19
20
21
22
23
24
25
26
27
28
29
30
31
32
33
34
35
36
def pGP (mmat1, numind, dim, numland):
  groupCoords = mmat1.iloc[:,0:2].groupby(mmat1.iloc[:,3])
  transCoords = groupCoords.apply(transScale) #translate and scale the sample data
  individuals = np.tile(np.arange(0,numind),numland)
  coordinates = pd.Series((np.arange(0,numland).reshape(-1,1)*np.ones(numind).reshape(1,-1)).flatten())
  transCoords['coordinates'] = coordinates
  transCoords['individuals'] = np.sort(individuals).astype(str)
  #this part of the code calculates Q-the convergence criterion
  #that is really the sum of the pairwise squared distances between all shapes in the sample
  #so that, after rotation these distances are minimized as much as possible
  arrayx = transCoords.iloc[:,0]
  arrayy = transCoords.iloc[:,1]
  forDist = np.concatenate([arrayx, arrayy], axis = 1).reshape(dim,numland*numind).T
  forDist = forDist.reshape(numind, numland*2) #distance function from scipy
  Qm1 = sd.pdist(forDist)
  Q = Qm1.sum()
  while absolute(Q) > 0.00001: #execute the following code until Q cannot be reduced anymore
    groupTrans = transCoords.iloc[:,0:2].groupby(transCoords.iloc[:,3])
    meanShapes = mshapr(transCoords) #calculate DataFrame of mean shapes excluding one individual at the time
    meanShapes['individuals'] = np.sort(individuals).astype(str)
    meanGroups = meanShapes.iloc[:,0:2].groupby(meanShapes.iloc[:,2])
    tempRot = pd.DataFrame()
    #following for loop performs partial Procrustes superimposition (pProc function from above) between
    #mean shapes and each configuration (individual)
    for ind in range(0, numind):
      tosto = pProc(groupTrans.get_group(str(ind)), meanGroups.get_group(str(ind)))
      tempRot = tempRot.append(tosto)
    tempX = tempRot.iloc[:,0]
    tempY = tempRot.iloc[:,1]
    tempDist = np.concatenate([tempX, tempY], axis = 1).reshape(dim,numland*numind).T
    tempDist = forDist.reshape(numind, numland*2)
    Qm2 = sd.pdist(tempDist)
    Q = Qm1.sum() - Qm2.sum()
    Qm1 = Qm2 #re-calculate the convergence criterion at each step
    transCoords = tempRot
  return tempRot

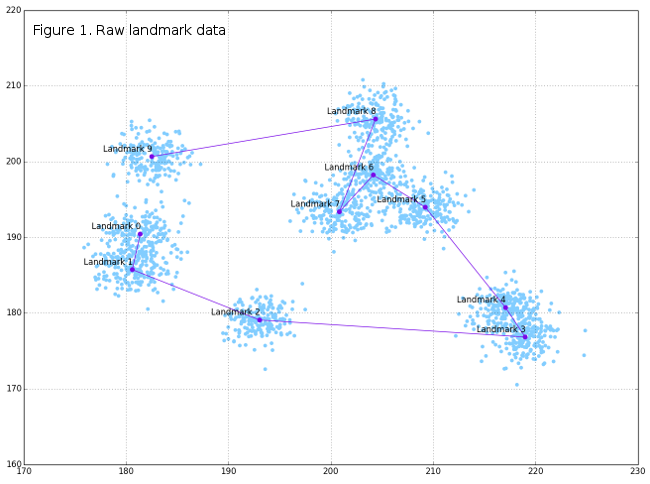
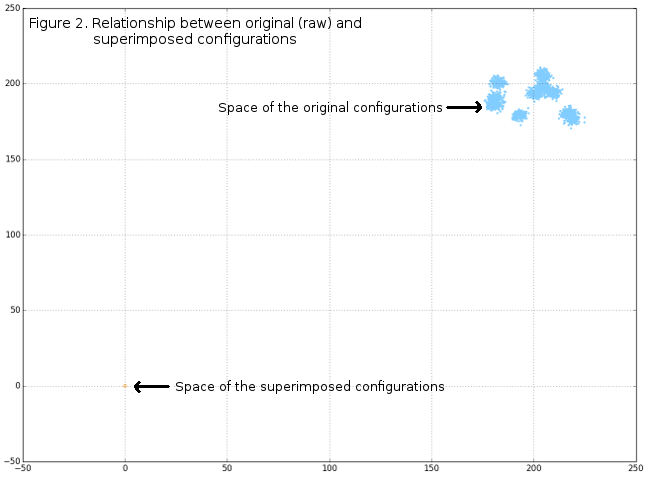
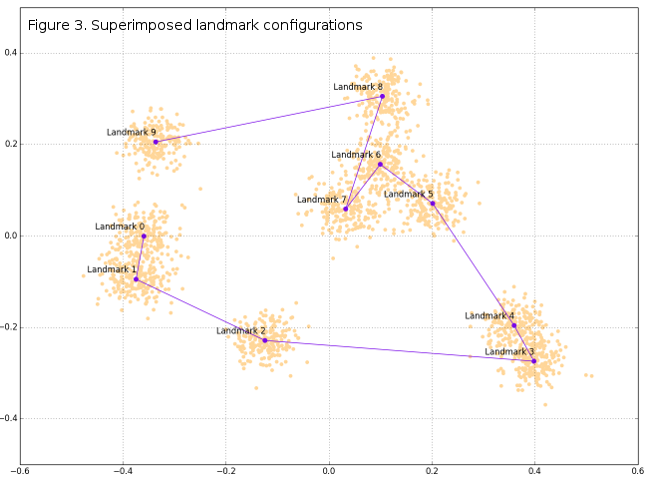
DataFrame tempRot holds the superimposed configurations (shape variables) that can, subsequently, be used in standard GM analyses and further. Of course, graphical display of superimposition results can be very interesting, and in this post only basic plots will be given, while some of the further posts may include more visualizations. Figure 1 shows the original raw-generated data, Figure 2 the spatial relationships between raw and superimposed data, while Figure 3 shows only superimposed data.

Plotting the data and the relationship of raw and superimposed data
1
2
3
4
5
6
7
8
9
10
11
12
13
14
15
16
17
18
19
20
21
procCoords = pGP(allCoords, 200,2,10) #perform superimposition
procoordinates = np.tile(np.arange(0,10),200)
procCoords['coordinates'] = procoordinates
meanShape1 = allCoords.iloc[:,0:2].groupby(allCoords.iloc[:,2]).mean() #calculate mean shape for raw data
meanShape1 = pd.DataFrame(polarRotator(np.array(meanShape1))) #natural ordering for landmark labels
plt.scatter(allCoords['x'], allCoords['y'], s = 30, c = "#82CDFF", edgecolors = 'none') #plot original sampled points
plt.scatter(meanShape1[0], meanShape1[1], s = 50, c = "#7909E8", edgecolors = 'none')
plt.plot(meanShape1[0], meanShape1[1], '-', color = "#7909E8")
labels = ['Landmark {0}'.format(i) for i in range(10)]
for label, x, y in zip(labels, meanShape1[0], meanShape1[1]): #annotate mean landmarks by numbers
  plt.annotate(label, xy = (x, y+0.4),ha = 'right', va = 'bottom')
plt.grid()
meanShape2 = procCoords.iloc[:,0:2].groupby(procCoords.iloc[:,2]).mean() #calculate mean shape for superimposed data
meanShape2 = pd.DataFrame(polarRotator(np.array(meanShape2))) #natural ordering for landmark labels
plt.scatter(procCoords['x'], procCoords['y'], s = 30, c = "#FFD699", edgecolors = 'none')
plt.scatter(meanShape2[0], meanShape2[1], s = 50, c = "#7909E8", edgecolors = 'none')
plt.plot(meanShape2[0], meanShape2[1], '-', color = "#7909E8")
for label, x, y in zip(labels, meanShape2[0], meanShape2[1]): #annotate mean landmarks by numbers
  plt.annotate(label, xy = (x, y+0.01),ha = 'right', va = 'bottom')
plt.grid()
#for Figure 2 just plt.scatter of both allCoords and procCoords in the same window


  1. If using IPython (:)) best way is to paste code with the %paste magic function.